
Hydroscapes
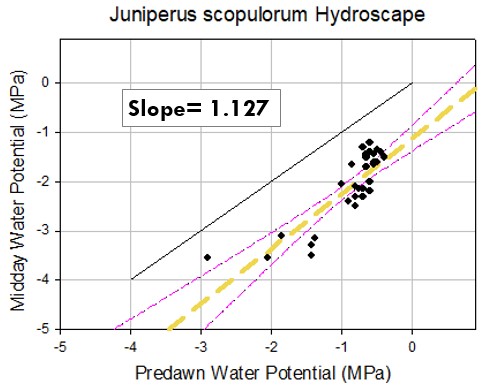
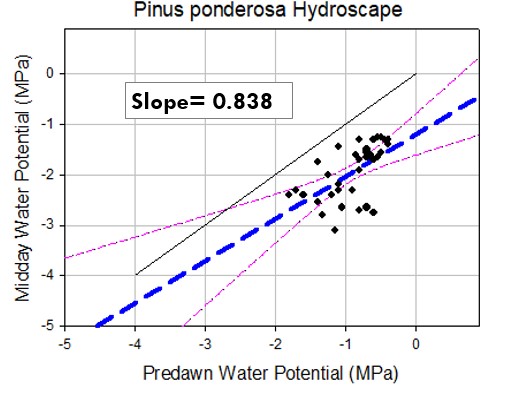
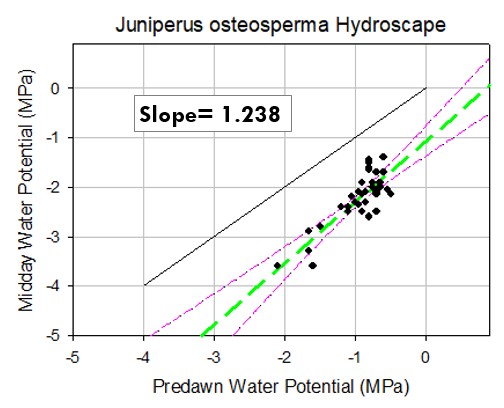
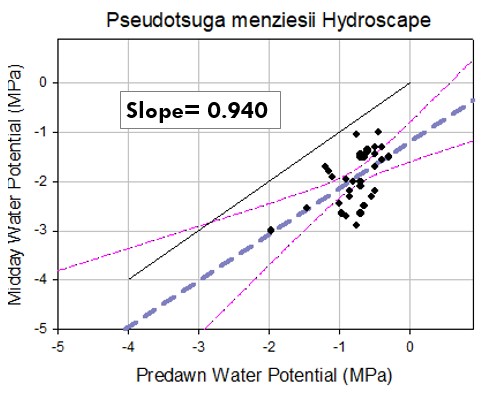
All Predawn and Midday Water Potentials plotted from the entire 2023 season. Graphs show the line of best fit (single colored dash line), the 95% confidence interval (pink dashed line), and a 1:1 line (solid black line).
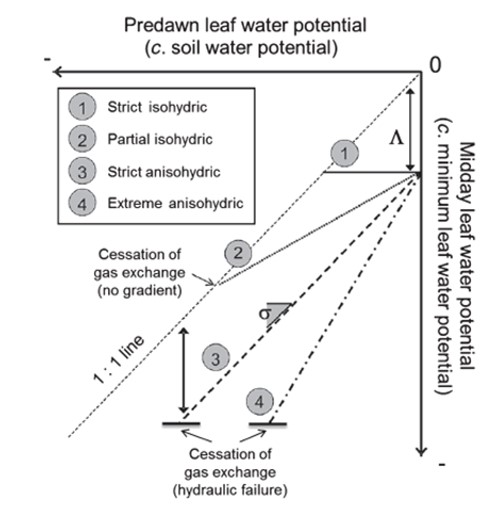
Slope is used as an indicator of sample’s iso-/aniso-hydry. A steeper slope (>1.0) indicates a more anisohydric strategy, and a smaller slope (<1.0) indicates an isohydric strategy.
For a visual aid, see below graph from the “All-Slopes” method by Martínez‐Vilalta et al. (2014).


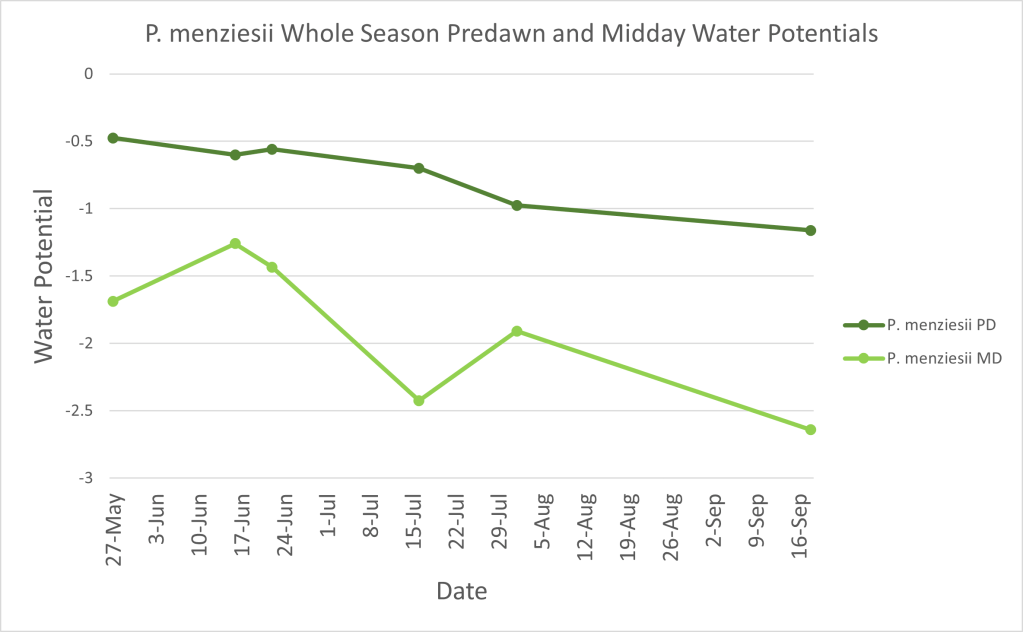
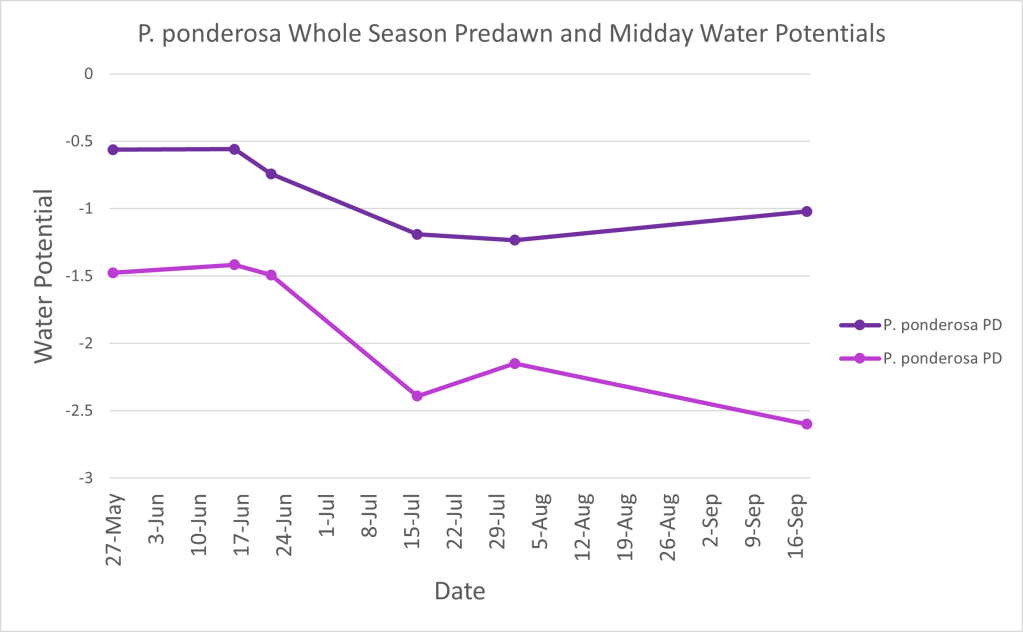

These are preliminary graphs to assist in giving context to the plants’ average predawn and midday water potentials through the season.
